

A UN vote concluded on 2 March 2022, overwhelmingly condemning the Russian invasion of Ukraine. It also demanded a full withdrawal of Russian troops. Of the 193 nations eligible to vote, 141 approved the motion, while five were against it. A total of 35 countries abstained and 12 were absent.
Naturally, the question is why some nations would oppose or decide not to vote on what to most seems like a very straightforward condemnation of war?
To understand some of the economic ties countries have to Russia, Investment Monitor has analysed how reliant they are on Russian trade.
Russia’s trade position
With 144 million people and a GDP of $1.5trn, it is unsurprising that Russia is a key player in global trade. It is the 14th-largest global economy by goods exports – exporting $337bn worth of goods. Russia runs a trade surplus, with its goods imports totalling $232bn, ranking 21st globally. Russia also has a strong comparative trade advantage in several commodities such as oil, coal, wheat and sunflower seeds due to natural resources and favourable harvesting conditions. This means that there are several countries that will be particularly impacted if trade with Russia should cease or diminish due to imposed sanctions or other reasons. The impact of the Ukraine-Russia war is likely to have a detrimental effect on global trade.
Top Russian goods by trade value
Russia exports sizeable volumes of several commodities. Its top ten export commodities account for two-thirds of its total exports. More than one-third of its total exports are petroleum oils (crude and not crude).
Nevertheless, we need more context to understand who Russia trades with and where Russian export specialism lies to truly understand where Russian trade reliance resides.
US Tariffs are shifting - will you react or anticipate?
Don’t let policy changes catch you off guard. Stay proactive with real-time data and expert analysis.
By GlobalDataCountries that import Russian goods
China’s close political and economic ties to Russia are evidenced by its Russian imports. China imported $57.2bn worth of Russian goods in 2020. This was more than double the value of UK imports (the second-largest importer of Russian goods). Although there are some neighbouring economies in the top ten list below, many others are large, economic powerhouses. Therefore, merely inducing reliance based on total trade value alone may not give a true reflection of Russian dependency.
How important are Russian exports to countries?
When we calculate the Russian imports into each country as a proportion of that country’s total imports, we see a significantly different picture. The table below shows Belarus as being most reliant on Russian exports. Almost half (49.6%) of total Belarusian imports were derived from Russia. We also see a higher presence of neighbouring economies in the top ten. When we compare the two tables (total value and proportion of total imports) the former has seven countries that approved the UN vote to deplore the Russian invasion of Ukraine. Yet, in the second table, only two of the top ten countries voted for the motion.
Russia's export specialisms
Using revealed comparative advantage (RCA) theory, we can assess the commodities that are most likely to be impacted by sanctions placed on Russia. An overview of the RCA calculation is:
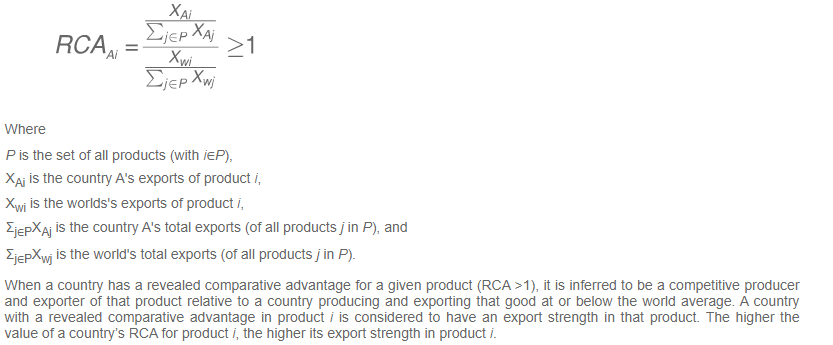
Revealed comparative advantage will tell us the commodities Russia exports more than its fair share of in a global context. The table below shows Russia having a RCA (a score greater than one) in 19 (out of 97) commodities. At the two-digit commodity level, Russia’s top export advantages were in nickel, fertilisers and mineral fuels.
However, delving deeper into the four-digit commodity level we can see more specific commodity specialisation. We also see higher RCA scores, indicated by increased export specialism in these commodities. We have identified 27 four-digit commodities where Russia has an RCA score above five – indicating that Russia exports more than five times its fair share of each of these commodities.
Although the dangers of asbestos are well known, it is still mined. Some countries have made using asbestos for building illegal; however, it is still legal to import and export the commodity. Russia has a RCA score of 31.7 on asbestos – a substantial comparative advantage in exporting it. It also accounts for almost two-thirds (62.9%) of global asbestos exports. However, trade values of this commodity ($174.9m) are relatively low compared with others listed.
Russia’s key exports, by trade volume, are oil and gas. Russian coal exports amounted to $12.4bn in 2020, while petroleum oils (crude and not crude) reached $118bn. With many countries, such as Germany, dependent on Russian energy, an instance boycott could destroy the domestic economies of many nations. While countries will certainly try to curtail their reliance on Russian energy, it is likely to be a much stickier commodity compared with others. Even with a move towards more renewable sources of energy, there is still a huge global reliance on Russian non-renewable energy exports.
Countries reliant on Russian exports
Having identified Russia’s key export commodities, the table below shows which countries are most reliant by having the largest trade volumes for Russian exports. China is one of Russia’s top three partners in 12 of the 27 commodities analysed. In fact, China is the primary destination for eight of Russia’s key exports:
- ferrous products
- sunflower seeds
- hydroxide and peroxide of magnesium
- coal
- petroleum oils (crude)
- wood sawn or chipped
- oxides of boron; boric acids
- fish
Turkey and the US, both of whom voted for the UN condemnation of the invasion of Ukraine, are two of Russia’s next most important trade partners. Russia exports more pig iron and platinum to the US than it does to any other country. Meanwhile, Turkey is the second-largest recipient of Russian exports in pig iron, sunflower seeds and wheat. In total, there were 31 unique countries that featured as one of the top three recipients of commodities in which Russia had a RCA score greater than five. This shows that there is a high degree of diversification in Russian exports and global sanctions could be highly impactful. However, that is assuming all countries agree to place sanctions on Russia.
Which other countries could the world turn to?
It is easy to suggest that all countries stop trading with Russia instantly. However, as identified above, the practicalities of this are much more complicated. Some key questions that must be answered are:
- Does the import country disapprove of Russia’s invasion of Ukraine?
- Can the import country import the same goods from another country (or countries), and at an affordable cost?
- Can it produce more of those goods domestically?
- Could it forego the commodity?
Should the answer to the above question be ‘no’, then reliance on Russia will be higher.
The table below shows the top five export countries for commodities where Russia has an RCA score greater than five.
In most cases, demand for these commodities is unlikely to fall, therefore a response is required on the supply side. While there are some commodities (for example, asbestos or ferrous products) where Russia controls a high market share, for most of the other commodities listed there are other countries producing and exporting similar levels to Russia. The challenge of countries swapping from Russian exports to another exporter is both production capacity and logistical. For example, Russia is the leading exporter of wheat and meslin – exporting 18% of the world’s total. Its closest export competitors are the US and Canada. Many US wheat farmers have actually found increased production difficult to achieve and have even experienced difficulties in shifting current crops due to high price inflation. This inflation is caused by Russia and Ukraine being two of the largest wheat producers. As production falls in Ukraine and sanctions are imposed in Russia, prices have soared.
Other commodities where Russia has a strong comparative advantage, such as fertilisers, are also contributing to the price hikes. Many countries are being impacted by falling wheat exports, particularly developing economies. Sri Lanka, which is Russia’s 19th-largest wheat export market, is undergoing an economic crisis due to food and fuel inflation.
Other commodities such as sunflower seeds and oil are highly dependent on Ukraine and Russia. Combined, both countries account for almost 60% of world exports. Production levels will be much lower, causing prices to soar.
Then there are logistical issues. For many of these commodities, Russia is a key player within Europe. With strong demand in Europe for commodities, and other global players further afield, supply chain issues and rising costs are inevitable. For example, Russia exports 15% of the world’s crude oil, a significant proportion of which is destined for Europe. Russia’s top three export partners for crude oil are China, the Netherlands and Germany. The European reliance on Russia can be seen through the Netherlands and Germany. Russia exported $9.42bn worth of crude oil to the Netherlands and $6.3bn to Germany in 2020. Only the United Arab Emirates (UAE) exports more crude oil than Russia globally. The UAE exports 22% of the global share. However, the Netherlands and Germany both have zero imports from the UAE. The US is the third-largest exporter of crude oil. The US exports $4.6bn worth of crude oil to the Netherlands (half of what Russia exports) and $1.7bn worth to Germany (a quarter of what Russia exports).
International companies pulling out of Russia
Country trade reliance can also be linked to those companies most exposed to the Ukraine-Russia conflict. GlobalData’s Multinational Companies Database identified 759 global companies with 2,225 subsidiaries in Russia. A significant proportion (95%) of these parent companies are foreign. The US, UK and France have the highest number of international companies present in Russia as well as the highest number of Russian subsidiaries. With many companies closing or suspending Russian operations, trade volumes are likely to be negatively impacted (as not all companies are exporters).
What happens next?
Russia is (or was) a key player in global trade. It has export specialisms across several commodities. Its invasion of Ukraine has caused trade shockwaves throughout the world. Reduced commodity supply has led, and will continue to lead, to inflationary pressures. The UN vote to condemn Russia’s invasion was widely approved. However, several countries abstained or were against the motion. Trade reliance has certainly played a role in these decisions, along with geopolitical motives.
A country's reliance on Russian exports appears to be present for two primary reasons: (i) neighbouring economies avail of goods with more cost-effective supply chains and quicker routes to market (ii) commodities where Russia has key specialisms – in terms of favourable production environments (for example, access to raw materials).
There will be some commodities where switching from Russian imports to other countries will be possible, but there are several where switching is much more difficult. New trade agreements will be required to ensure supply meets demand. Supply chain efficiencies will also need to be harnessed with the goal of keeping prices from overinflating and guaranteeing a sustainable future. In the shorter term, higher prices will continue and trade volumes will likely decline in 2022.
Depending on the outcome of the war, we could see a new ‘two world’ trade structure. Those that will trade with Russia may have increased dependencies, while those that are unwilling to trade with Russia will see dramatic reductions in Russian imports. With the West looking to disassociate itself from a reliance on Russian, neighbouring economies in eastern Europe and Asia have a more difficult task economically to find replacements. China's next moves will be eagerly monitored. Should it align further with Russia (for example, by supplying weapons/troops), one would expect sanctions to be implemented and the trade landscape to split further.
Understand the impact of the Ukraine conflict from a cross-sector perspective with the Global Data Executive Briefing: Ukraine Conflict.
