
The Regional Comprehensive Economic Partnership (RCEP) Agreement entered into force on 1 January 2022 after almost a decade of negotiations. The agreement brings together Australia, Brunei, Cambodia, China, Indonesia, Japan, Laos, Malaysia, Myanmar, New Zealand, the Philippines, Singapore, South Korea, Thailand and Vietnam, to create the world’s largest economic bloc.
These 15 Asia-Pacific economies account for approximately 30% of the world’s population and GDP, making the RCEP the largest trade deal in history.
Discover B2B Marketing That Performs
Combine business intelligence and editorial excellence to reach engaged professionals across 36 leading media platforms.
China’s economy goes from strength to strength
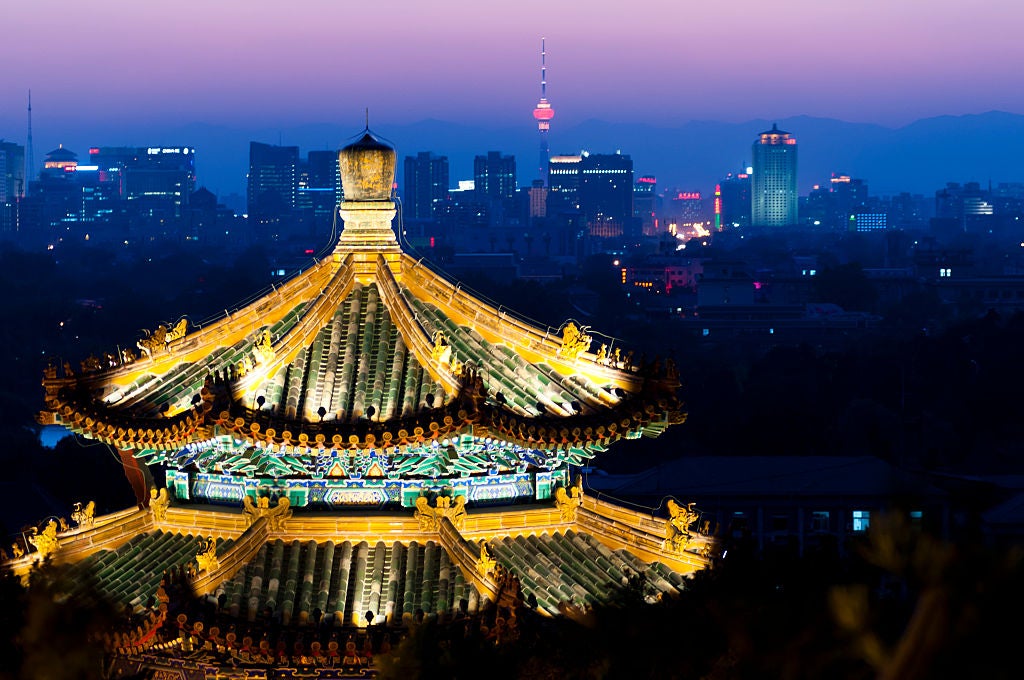
China is by far the largest economy involved in the RCEP. At $14.7trn, it accounted for more than half of the combined GDP of RCEP member countries in 2020.
China is the second-largest economy in the world and is forecast to take over the US by 2028. Its GDP grew consistently over the period analysed (1990–2020), even during periods of severe global hardship. In the fallout from the 2008 global recession, China’s economy grew by 11% in 2009. More recently, China saw a 3.1% increase in GDP in 2020 while many other major economies contracted due to the economic impact of Covid-19.
According to figures released by China’s National Bureau of Statistics, the country’s GDP expanded by 8.1% in 2021. In turn, China’s economy surpassed the EU’s in size for the first time in history.
Japan is the second-largest RCEP economy, representing roughly one-fifth of the partnership’s overall GDP in 2020. The country is the third largest in the world by nominal GDP and has the third-largest consumer market.
Japan has a reputation as one of the world’s most innovative countries and is one of the largest R&D spenders. The Tokyo-Yokohama area ranked as the top science and technology cluster in the 2021 Global Innovation Index.
In recent years, Japan has been hit by periods of economic turbulence. The country’s GDP fell by 16.9% between 2012 and 2013 due to weakened exports and a row with its main trading partner China. The economy continued to decline in 2014 and 2015. After a brief increase in 2016, GDP dropped by 1.4% in 2017. Following two years of economic growth in 2018 and 2019, GDP dipped again, by 1.8%, in 2020 due to Covid-19.
South Korea is the third-largest RCEP nation by GDP. It is considered one of the fastest-growing developed countries in the world. According to the World Bank, real GDP growth in the country averaged 5.5% annually between 1988 and 2019, driven by annual export growth averaging 9.3% during the same period.
Singapore had the highest GDP per capita of all countries analysed at $59,798 in 2020. The city-state is known as one of the world’s most progressive and business-friendly economies due to its sound monetary and fiscal policies and political stability. As a result, Singapore ranked first on the Heritage Foundation’s 2022 Index of Economic Freedom.
Australia recorded the second-highest GDP per capita of the RCEP members in 2020 at $51,693. Australia’s resilient economy and proximity to the Asian market make it an attractive destination for investors. According to figures from the OECD, Australia’s recovery post-Covid is well under way. Real GDP is forecast to grow by 3.8% in 2021, 4.1% in 2022 and 3% in 2023.
New Zealand had the highest population growth of all countries analysed at 2.1% in 2020. This can be attributed to natural increases as well as international migration. The country’s economy quickly bounced back from Covid-19 thanks to its strict lockdowns and measures to protect jobs and incomes. Its GDP is expected to grow by 4.7% in 2021, by 3.9% in 2022 and by 2.5% in 2023.
Laos had the highest inflation rate out of the RCEP members in 2020 at 5.1%. The country’s rising inflation is thought to be due to the rising cost of fuel as well as the depreciation of the Lao currency, the kip. In an effort to boost productivity, the government has decided to cut VAT from 10% to 7% in 2022.
Vietnam’s inflation rate hit 3.2% in 2020 due to rising food prices, medical costs and tuition fees. This trend looks set to continue in 2022 in light of the global increase in fuel prices. The government is reportedly considering increasing imports, reducing taxes and further support from the national reserves to ease the situation.
Brunei is the smallest economy of the RCEP members, standing at $12bn in 2020. The country relies heavily on the oil and gas sector, which accounts for 90% of government revenue, 90% of exports and more than half of GDP. In addition, the country has limited manufacturing capacity and depends on imports for most of its manufactured goods and food.
China, Australia and Singapore come out on top for FDI
Foreign direct investment (FDI) across the RCEP countries fell dramatically in the fallout from Covid-19. Overall, FDI project numbers fell by 38.9% between 2019 and 2020.
China is the largest FDI recipient out of all countries analysed. It received 412 FDI projects in 2020, representing 22.3% of RCEP FDI that year. This is less than half the number of FDI projects China received in 2019 (835).
Foreign investment in China has largely focused on manufacturing, IT, real estate and business services. Recent major projects include Germany-based car giant BMW’s $3.2bn expansion in Tiexi and Japan-based Nidec’s planned $921bn motor factory in Dalian.
Between 2003 and 2015, China consistently received more than 1,000 FDI projects each year. However, in 2014, FDI project numbers began to decline, falling year on year until 2017. Project numbers rose in 2018, before dropping in 2019 and halving in 2020 in light of Covid-19.
Experts have warned that the high levels of FDI China previously received are no longer sustainable due to domestic companies becoming more prominent and increased competition. In addition, rising tensions with the US may also impact China’s investment attractiveness.
Australia attracted 321 FDI projects in 2020, the second-highest amount out of all countries analysed. The country’s project numbers rose by 7.6% between 2016 and 2018 before falling by 1.1% in 2019 and by 25.9% in 2020.
According to figures from Austrade, Australia’s national investment promotion agency, one in ten Australian jobs are supported by FDI, accounting for 1.2 million people. Businesses in the country supported by FDI hold $2.7trn in assets, which is approximately one-quarter of Australia’s overall assets. In addition, FDI has also contributed to generating two-fifths of the country’s goods and services exports.
Singapore received the third-largest number of FDI projects of the RCEP members. The city-state is also by far the top FDI destination per capita at 5.3 projects per 100,000 people. It significantly exceeds the next closest country, New Zealand, at 1.3 projects per 100,000 people.
Key industries for investment include aerospace, electronics and pharmaceuticals. Singapore is also a popular regional headquarters location for multinational companies (MNCs). According to data from Singapore’s Economic Development Board, 46% of Asian regional headquarters are based in the city-state. Moreover, 59% of the Asian regional headquarters of technology MNCs are based in Singapore.
Indonesia attracted the second-highest level of FDI-related capital investment, following China. Despite the economic impact of Covid-19, FDI project values in the country soared from $12bn in 2019 to $20.2bn in 2020.
While many countries around the world are tightening their FDI regulations, Indonesia is one of the few that is easing its screening mechanisms. In July 2021, the government amended its list of sectors prohibited from FDI by opening up the telecommunications, construction, distribution and drilling industries to foreign investors.
In January 2022, Malaysia was named the best country in emerging South East Asia for FDI attractiveness in the Milken Institute’s Global Opportunity Index. It was recognised for its attempts to ease FDI restrictions and for introducing policies to facilitate trade. Malaysia attracted 100 inward FDI projects in 2020 across sectors including tourism, logistics and electronics.
Brunei experienced the largest percentage increase in FDI project values in 2020. In September of that year, China-based chemical fibre products manufacturer Hengyi announced plans to invest $13.7bn to expand its refinery and petrochemical complex in Palau Muara Besar. In comparison, the country attracted FDI projects worth a combined total of $43.2m in 2019.
In Cambodia, FDI project values represented 6.4% of the country’s overall GDP in 2020. Its top source countries for investment include Singapore, Japan, Malaysia, Thailand, the UK, Canada and the US. Key FDI sectors range from finance, manufacturing and real estate to agriculture and construction.
The Philippines saw the biggest percentage drop in FDI project numbers between 2019 and 2020. FDI projects fell by 66.7% from 147 to 49 projects. Investment flows were heavily impacted by the eruption of the Taal Volcano in January 2020 and the spread of Covid-19, leading to severe disruption in the manufacturing, agriculture, tourism and construction sectors.
New Zealand is the least corrupt country in the world
New Zealand topped Transparency International’s 2021 edition of the Corruption Perception Index for the third year in a row. The country scored 88 out of 100, alongside Denmark and Finland.
New Zealand is one the Asia-Pacific region’s most prosperous countries and offers investors political stability as well as a transparent and open business environment. In addition, it takes just half a day on average to start a business in New Zealand – the shortest time across all the RCEP members.
South Korea is a global centre for innovation and its well-developed digital infrastructure make it an attractive destination for investors. The country has the highest number of broadband subscriptions per 100 people (43.6 in 2020) and the highest percentage of individuals using the internet (95.1% in 2017).
Singapore has the lowest corporation tax rate of all countries analysed at 17%. The city-state has a network of tax treaties with more than 85 countries. Through its tax regime, Singapore aims to stimulate economic activity and ensure long-term, sustainable growth. It also offers investors strong government support and intellectual property protection.
Myanmar has the lowest electricity access of all the RCEP countries analysed at 68.4% in 2019. The country is one of the poorest in South East Asia following decades of military rule from 1962 to 2011. After ten years of quasi-democracy, the military rejected the outcome of the country’s second democratic elections and seized control again in February 2021. In February 2022, the International Labour Organisation warned that Myanmar was on the brink of economic collapse and facing a humanitarian crisis.
Laos had the smallest number of broadband subscriptions across the RCEP members at 1.1 per 100 people in 2019. It also takes the longest time on average to set up a business in Laos compared with all other RCEP countries (173 days).
Which RCEP countries lead for liveability?
Japan has one of the highest life expectancies in the world and the highest of all RCEP countries at 84.4 years. Although this is a testament to the country’s highly regarded universal healthcare system, it also presents economic challenges. Japan has the highest age dependency ratio – the ratio of dependants to working age population – of all countries analysed at 69.1%.
In 2019, the gross enrolment ratio in tertiary education for Australia was 116%, the highest of all countries analysed. Australia benefits from one of the most diverse, highly skilled and multilingual workforces in the world. According to the OECD’s Indicators of Talent Attractiveness, Australia is the best OECD country for talent attractiveness for highly educated workers.
Cambodia has the lowest unemployment rate out of all countries analysed at 0.3% in 2020. This figure can be attributed to the fact that the majority of Cambodia’s working population is employed in the informal sector, where wages are often low and unregulated.
Thailand also has a relatively low unemployment rate (1% in 2020). However, the country's definition of unemployed is very limited, and only considers people who do not work a single hour per week as jobless. It also excludes business or farm owners.
Myanmar has the lowest life expectancy among the RCEP countries. Its average life expectancy in 2020 was 67.1 years. The military coup in February 2021 and Covid-19 have drastically impacted Myanmar’s economy and the welfare of its citizens.
The World Bank predicts that Myanmar's GDP will contract by approximately 18% in 2021, which could see the loss of a million jobs. The number of people living in poverty is also likely to more than double by the beginning of 2022, compared with 2019.
Laos and New Zealand are RCEP’s greenest economies
China is a major polluter, accounting for almost 75% of the carbon emissions of all countries analysed. According to research by Rhodium Group, it emits more greenhouse gas than the entire developed world combined, representing 27% of global greenhouse gases in 2019. President Xi Jinping has pledged that China will reach net-zero emissions by 2060 with a peak no later than 2030.
Renewable energy sources accounted for almost 97% of Laos’ energy mix in 2018. The country’s largest source of energy is hydropower followed by bioenergy. In 2011, Laos launched its Renewable Energy Development Strategy, which aims to develop new renewable energy resources that the country has not yet widely explored, including solar and wind energy.
More than three-quarters of electricity generated in New Zealand in 2018 was derived from renewable energy sources, mainly hydropower. The government aims to generate 90% of electricity from renewable sources by 2025.
More than 99.9% of Brunei’s energy mix comes from fossil fuels. The government does recognise that an over-dependence on oil and gas is not sustainable in the long term. As such, it aims to increase the use of renewables to make up 30% of Brunei's power generation by 2035.
Singapore also relies heavily on fossil fuels, which accounted for 98.6% of its energy mix in 2018. The city-state has faced several difficulties when attempting to transition to renewable energy. Developers have found that there isn’t enough space for large solar plants, there are no major rivers to install hydropower facilities and wind speeds are too low to power turbines. As a result, Singapore has turned to floating solar farms and vertical panels to increase its clean energy supply.